Groundwater · Construction · Field Monitoring
Dewatering Assessments: Understanding Groundwater, Drawdown, and Construction Risk
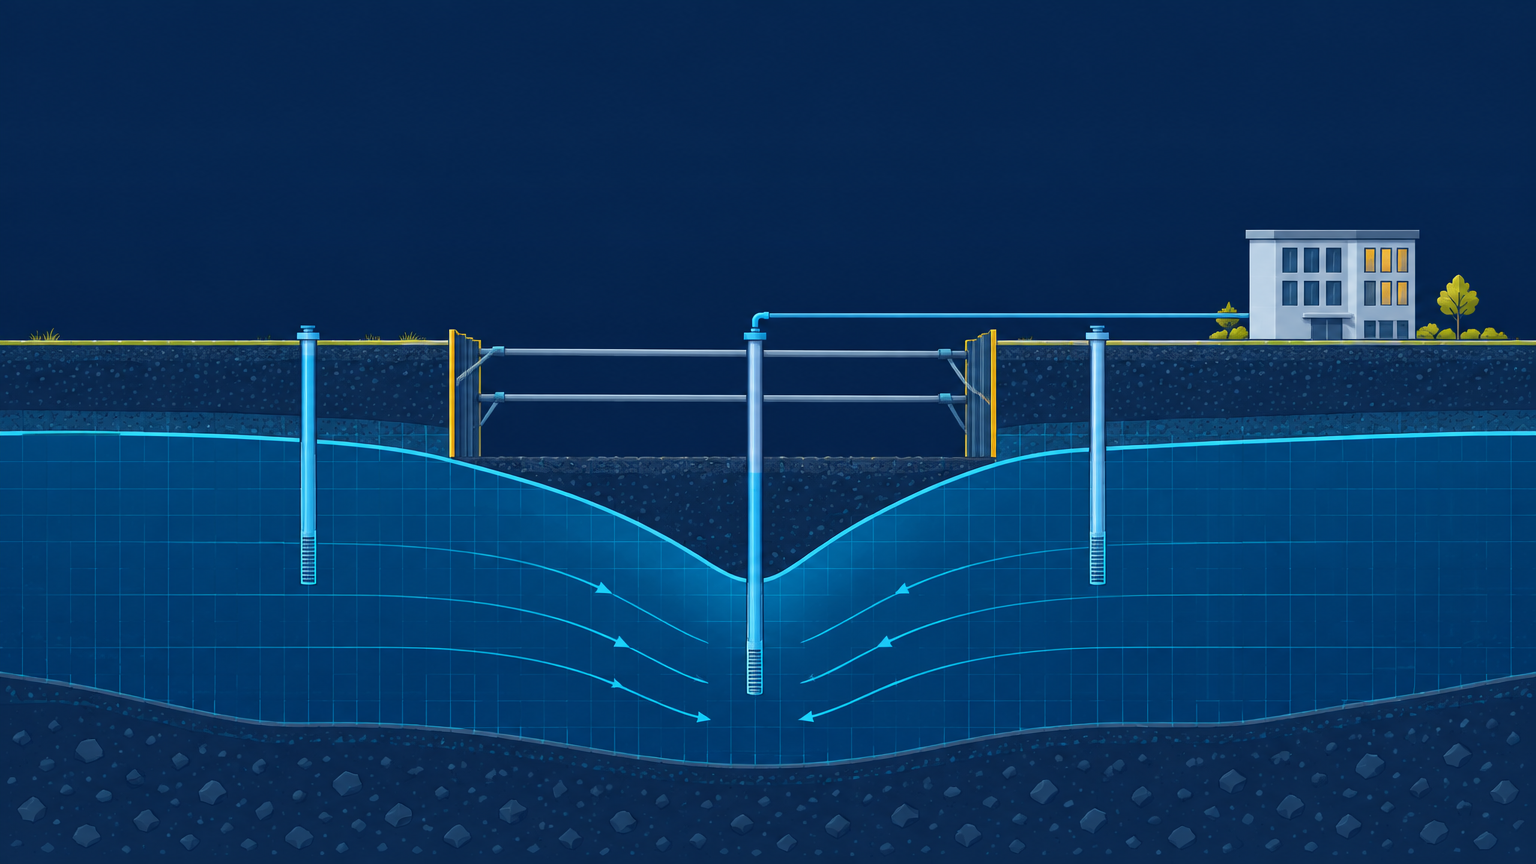
Construction dewatering is more than removing water from an excavation. It involves understanding where groundwater is, how it moves, how pumping changes groundwater levels, what those changes may affect, and how the system should be monitored throughout construction.
Illustrative conceptual cross-section — not a site-specific engineering prediction.
Groundwater
→
Excavation
→
Pumping
→
Drawdown
→
Monitoring
→
Assessment
01 — Fundamentals
What Is Construction Dewatering?
Construction dewatering refers broadly to controlling groundwater and/or accumulated water so that construction can proceed within an excavation or other work area. U.S. Army Corps of Engineers technical guidance (EM 1110-2-1913, Dewatering: Methods, Evaluation, Design, Installation, and Performance Monitoring) treats it as a groundwater-control discipline: understanding subsurface conditions, selecting an appropriate method, installing the system, and monitoring its performance through construction. FHWA engineering guidance covers the same ground for highway excavations (FHWA-HRT-05-168, Design and Construction of Drilled Shafts and related groundwater-control circulars). No single method is universally appropriate — the right approach depends on the site.
Surface water control
Managing rainfall, runoff, ponding, and other surface-water sources so that water does not accumulate where work is happening.
Rainfall and site runoff
Ponding in low areas
Diversion and grading
Sumps for surface water
Groundwater control
Managing groundwater that enters or affects an excavation, so that work can proceed in suitable conditions.
Sumps and open pumping
Wellpoints
Pumping wells
Horizontal drains
Cutoffs and barriers
Pressure relief
Combined methods
On many projects the two run together: surface water is collected and removed, while groundwater is intercepted before it reaches the working surface. The methods above are described in detail in the dewatering-methods section below.
02 — Why assessments matter
The Water You Remove Is Only Part of the Problem
The broader engineering question is: what happens to the groundwater system when water is removed? A dewatering assessment evaluates the response of the groundwater system, what that response may affect, and how conditions are checked during construction.
Pumping
↓
Groundwater levels change
↓
Drawdown develops
↓
Potential effects →
Hover or tap a stage to read what happens at each step.
Excavation conditions
Working surface, inflow, and seepage conditions in the excavation.
Excavation stability
Seepage gradients and pore pressures can influence excavation stability (USACE EM 1110-2-1913).
Adjacent structures
Groundwater lowering can contribute to settlement and potential damage to adjacent structures in susceptible conditions (USACE).
Utilities
Buried utilities may be sensitive to changes in groundwater level.
Nearby wells
Pumping can lower groundwater levels at nearby water-supply wells, depending on hydrogeologic conditions (USACE).
Groundwater flow
The direction and rate of groundwater movement can change across the site.
Streams and surface water
Groundwater pumping can interact with streams and groundwater-dependent features (USGS).
Settlement
In susceptible soils, lowering groundwater can contribute to ground settlement (USACE).
Water quality
Moving water can mobilize constituents; discharge may need management.
Discharge requirements
Removed water may be subject to monitoring and control requirements where discharged.
Whether any of these effects occurs — and how significant it is — depends on site conditions, geology, groundwater conditions, the pumping method, rate and duration, and the surrounding environment. Not every dewatering project causes settlement or structural damage; the purpose of an assessment is to evaluate the potential. USACE dewatering guidance discusses these potential effects in detail.
03 — Interactive conceptual model
What Happens When a Well Starts Pumping?
Before pumping, groundwater rests at a static groundwater level. When a well starts pumping, the water level near the well drops — that drop is called drawdown — and it forms an expanding, funnel-shaped depression in the water table known as the cone of depression (USGS, Groundwater Wells; Aquifers and Groundwater). Adjust the conceptual controls below to see how rate, duration, and distance change the response.
Pumping controls
Pumping rate: 50 L/min
Pumping duration: 8 h
Observation well distance: 40 m
Conceptual illustration — actual drawdown depends on site-specific hydrogeologic conditions.
This is an educational conceptual model, not a predictive engineering model. Real drawdown depends on aquifer thickness, hydraulic conductivity, storage, recharge, boundaries, and well efficiency — concepts covered by USGS groundwater references.
04 — Interactive chart
Drawdown Changes With Time and Distance
Drawdown is largest at the pumping well and decreases with distance; for a given pumping rate, the cone of depression typically deepens and expands as pumping continues — a relationship documented in USGS groundwater technical references on pumping, drawdown, and aquifer response. Toggle the conceptual pumping duration and click an observation well to locate it on the curve.
- Drawdown — Intermediate (12 h)
- Selected: OW-2 at 30 m
Pumping duration
Observation wells
At OW-2 (30 m)
Conceptual drawdown ≈ 4.1 m after 12 h at 50 L/min.
The magnitude of drawdown at any point depends on factors including the pumping rate, pumping duration, hydraulic properties of the aquifer materials, boundary conditions, recharge, well configuration, and distance from the pumping well. Conceptual groundwater references from USGS Aquifers and Groundwater cover these dependencies without requiring the reader to solve the governing equations — which is not the objective here.
05 — Signature data flow
A Dewatering Assessment Is Built From Multiple Data Sources
No single dataset makes an assessment. The diagram below shows the five input streams that converge — subsurface investigation, groundwater monitoring, pumping information, laboratory and water-quality data, and site context. Hover or click any stream to see the representative information it contributes.
Subsurface Investigation
· Soil and rock descriptions
· Hydraulic properties
· Groundwater observations
· Well construction information
Groundwater Monitoring
· Monitoring and observation wells
· Piezometers where applicable
· Groundwater elevations
· Measurement dates and times
· Pumping conditions at measurement
Pumping Information
· Pumping wells
· Pumping rates (L/min)
· Pumping duration
· Pumping schedules
· Operational changes
Laboratory / Water Quality
· Turbidity
· Total suspended solids (TSS)
· Hydrocarbons
· Metals
· Other site-specific parameters
Site Context
· Excavation geometry and sequence
· Nearby structures and utilities
· Nearby wells
· Surface-water features
· Discharge location
06 — Subsurface context
Why Subsurface Information Matters
Groundwater behavior cannot be understood independently of the materials through which it moves — a principle central to USGS Aquifers and Groundwater. A sand-and-gravel unit transmits water very differently than a clayey till; the same pumping rate can produce very different responses in each. Toggle the layers below to see how geology, groundwater, and monitoring relate.
Geology: what the boreholes tell you
Boreholes establish the stratigraphy — which units are present, their thickness, and their descriptions. Hydraulic testing and observation are needed to interpret how those units transmit water; a log alone is not sufficient to determine aquifer properties. More info can be found here.
Fill / weathered crust — variable
Sand and gravel (more permeable) — relatively high permeability
Glacial till (lower permeability) — relatively low permeability
Bedrock — site-specific
07 — Monitoring
A Dewatering System Has to Be Observed, Not Just Designed
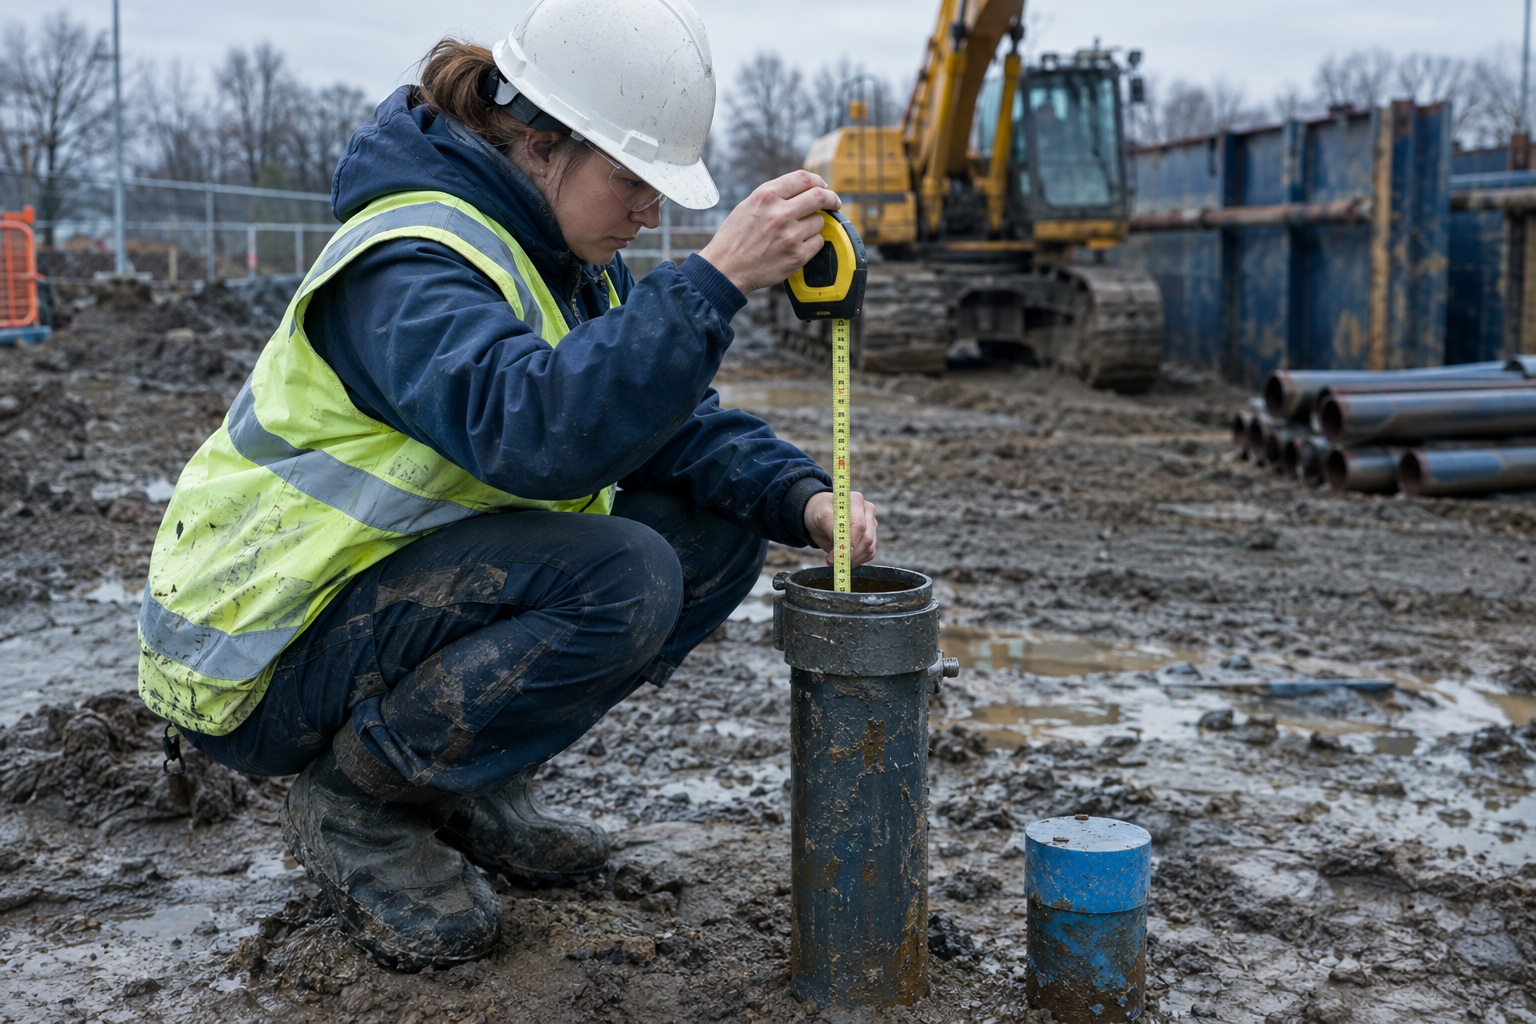
Performance monitoring is integral to construction dewatering: USACE EM 1110-2-1913 frames design, installation, and performance monitoring as one continuous engineering task. Monitoring establishes baseline conditions, shows the response to pumping, reveals spatial differences between wells, tracks changes over time, and indicates whether conditions remain within project expectations — or whether mitigation or operational changes may be required. Monitoring programs are project-specific; this conceptual hydrograph shows one illustrative layout.
Isolate a well
View
Note the response differences: the near well (OW-1) responds quickly and deeply, while the distant well (OW-3) barely moves — spatial differences that monitoring is there to reveal. After pumping stops (h 72), levels recover.
08 — Method selection
Different Excavations Require Different Groundwater-Control Strategies
USACE and FHWA guidance describe a family of groundwater-control methods rather than a single preferred one (USACE EM 1110-2-1913; FHWA groundwater-control engineering guidance). The methods are presented side by side here — not ranked — because suitability depends on the site.
How it works
A line of closely spaced, small-diameter wellpoints around the excavation is connected to a common header main and pumped.
Typical use context
Commonly used where the required drawdown is within practical suction-lift limits and the soils will respond to this spacing.
Key consideration
Spacing, lift limits, and staged installation as excavation deepens.
Combinations of methods are common — for example, a cutoff with internal sumps, or wellpoints supplemented by pressure relief.
09 — Risks beyond the excavation
Dewatering Can Affect More Than the Excavation
An excavation sits inside a wider groundwater system — buildings, utilities, wells, and streams may all be sensitive to groundwater lowering. USACE guidance and USGS references discuss these potential effects. Toggle the categories to see what an assessment looks at — remembering that these effects may occur, and only depending on site conditions.
Ground Settlement
Adjacent Structures
USACE guidance notes that groundwater lowering can contribute to settlement and potential damage to adjacent structures, depending on conditions.
Nearby Wells
Pumping can lower groundwater levels at nearby water-supply wells, depending on hydrogeologic conditions and distance (USACE).
Surface Water
Excavation Stability
10 — Water quality & discharge
Dewatering Water Is Also a Discharge-Management Question
Water removed from an excavation may need to be characterized, treated, monitored, and discharged according to applicable requirements. Requirements vary by jurisdiction and receiving environment — the examples below are jurisdiction-specific examples, not universal rules. Actual requirements depend on location, volume, discharge destination, water quality, project circumstances, and applicable legislation.
Groundwater enters excavation
→
Collected / pumped
→
Characterized
→
Treatment if required
→
Discharge / transfer
Discharge water may need to be characterized (e.g., turbidity, TSS, hydrocarbons, metals).
EPA Construction General Permit resources
Construction dewatering discharges may be subject to monitoring and control requirements, including turbidity requirements in applicable circumstances.
Ontario construction-dewatering requirements
Construction-site dewatering can be subject to water-taking, discharge, monitoring, and reporting requirements under current Ontario regulations and guidance.
B.C. groundwater diversion requirements
Groundwater diversion for construction dewatering can involve authorization requirements and exemptions depending on circumstances, under current B.C. requirements.
11 — Interactive
The Assessment Is the End of a Data Chain
A finished assessment rests on a long chain of upstream records. Click a stage to see the representative data fields it works with. This is an educational visualization, not a product demonstration.
1. Field Observations
→
2. Laboratory / Testing
→
3. Monitoring Dataset
→
4. Analysis
→
5. Assessment Outputs
Monitoring Dataset — representative fields
Why the chain matters
Each stage adds structure to raw observation: a water level becomes an elevation when referenced; an elevation becomes a measurement when timestamped; a measurement becomes interpretable when tied to pumping condition and well identity. Gaps at any link weaken everything downstream — the assessment can only be as connected as the data feeding it.
12 — Time-series perspective
Why Time-Series Groundwater Data Matters
A single water-level reading is a snapshot; a time series tells a story. The chart below follows four conceptual monitoring wells — A through D — over a 72-hour period with a pumping interval. Hover over measurements, isolate a well, and compare responses.
Wells
View
What a time series can reveal: baseline variation before pumping, the pumping response as levels fall, differences between locations (note the lag and magnitude spread), and recovery after pumping changes or stops. Interpretation still requires site context and professional judgment.
13 — Data quality
Good Dewatering Data Is More Than a Spreadsheet of Water Levels
Check each property below to see what it contributes. A monitoring record that carries all of these properties is far easier to interpret — and far easier to defend — than a bare column of water levels.
Location
Every measurement should have a known monitoring location.
Time
Measurements need reliable timestamps.
Elevation / Reference
Water levels need a consistent reference framework (e.g., m bgs relative to a surveyed datum).
Pumping Context
The measurement should be interpretable in relation to pumping conditions.
Well Identity
The monitoring point must be unambiguously identified.
Subsurface Context
Groundwater observations should be interpreted alongside the relevant subsurface information.
Quality / Provenance
Measurements should retain enough context to understand where they came from and how they were collected.
Continuity
Repeated measurements become more useful when they form a coherent time series.
A structured monitoring record — example
| Date | Time | Well | Pumping | Static (m bgs) | Current (m bgs) | Method | Sample |
|---|---|---|---|---|---|---|---|
| 2026-06-02 | 07:30 | PW-1 | None | 8.42 | 8.42 | manual dip | |
| 2026-06-02 | 13:45 | PW-1 | 45 L/min | 8.42 | 9.86 | manual dip | DS-2401 |
| 2026-06-02 | 13:50 | OW-1 | 45 L/min | 5.1 | 5.94 | pressure transducer | |
| 2026-06-02 | 13:50 | OW-2 | 45 L/min | 5.32 | 5.48 | pressure transducer | |
| 2026-06-03 | 08:15 | OW-1 | 45 L/min | 5.1 | 6.12 | pressure transducer | DS-2409 |
Every row carries a well identity, timestamp, reference-based depth, pumping condition, collection method, and — where sampled — a lab link. That structure is what lets hydrographs, drawdown maps, and assessment outputs be assembled without guesswork.
14 — Workflow
From Site Investigation to Construction Decision
A dewatering project moves through recognisable stages, each feeding the next. Click a stage to see the typical questions, representative data, and typical outputs. Actual engineering workflows vary by project.
1. Understand the Site
→
2. Characterize Groundwater
→
3. Identify Potential Dewatering Conditions
→
4. Select / Evaluate Groundwater-Control Approaches
→
5. Establish Monitoring
→
6. Observe and Interpret Response
→
7. Adjust and Document
Typical questions
· Is the response consistent with expectations?
· Do spatial differences make sense?
· Are conditions within project expectations?
Representative data
· Groundwater elevations over time
· Pumping rates and schedule
· Inspection observations
Typical outputs
· Updated hydrographs
· Drawdown comparisons
· Interpretation notes
15 — Scope of general guidance
There Is No Universal Dewatering Design
Dewatering design and assessment depend on the full combination of factors below — USACE guidance treats construction dewatering as a site-specific engineering exercise for exactly this reason. General educational material — this page included — describes concepts, not designs. Professional engineering and hydrogeological judgment is required for project-specific design and assessment.
16 — From assessment to connected data
What If the Data Behind the Assessment Were Connected From the Start?
Every workflow described above involves multiple forms of field, monitoring, laboratory, spatial, and reporting data — often collected by different people, at different times, in different formats. This closing section introduces one way that fragmented project information can become a structured workflow.
aQRate is a field data collection and management platform that can be configured to connect these project records into a structured workflow — boreholes, groundwater measurements, pumping context, lab results, and visualizations feeding one assessment instead of scattered files. The chain below shows an example of how structured project data can support a connected workflow for a dewatering assessment.
Start from the Dewatering Assessment template
The animated form below is the actual Dewatering Assessment field form — wells, pumping context, groundwater levels, and lab flags — as crews fill it out on site.
Dewatering Assessment
Project ID*
Date*
Time*
Well ID*
Location*
Pumping Rate (L/min)*
Static GW Level (m bgs)*
Current GW Level (m bgs)*
Sample ID
Lab Analysis Required
Total Suspended Solids
Benzene
Dewatering Assessment
PRJ-HIGH-2026
2026-06-23T00:00:00.0000000Z
08:00:00
OW-4
53.56468, -113.43338
0
2.47
3.45904092669934
—
—
—
—
Report ready: Dewatering Technical Assessment
See the Dewatering Assessment Demo
Explore the complete demonstration workflow, including boreholes, groundwater monitoring, laboratory data, visualizations, and the assessment outputs.
See the Dewatering Assessment Demo →Explore the Dewatering Assessment Workflow
See how aQRate can be configured for dewatering assessment field data, monitoring, visualizations, and reporting.
Explore the Workflow →Sources & Further Reading
Every externally verifiable technical claim on this page links to one of the sources below. Regulatory examples are jurisdiction-specific; always consult the current official source for your location.
U.S. Army Corps of Engineers
Dewatering: Methods, Evaluation, Design, Installation, and Performance Monitoring (EM 1110-2-1913)Dewatering methods, groundwater-control systems, design considerations, performance monitoring, adjacent structures, and nearby water wells.
U.S. Geological Survey
Groundwater Wells — Water Science SchoolGroundwater levels, pumping, drawdown, and cone of depression.
U.S. Geological Survey
Aquifers and Groundwater — Water Science SchoolGroundwater movement, aquifer properties, effects of pumping, recharge and groundwater response.
U.S. Geological Survey
Ground-Water Development and Drawdown ReferencesRelationship between pumping, duration, hydraulic properties, and drawdown.
Federal Highway Administration
Groundwater technical guidance for construction (FHWA engineering publications)Groundwater control during construction, excavation dewatering, wellpoints, pumping wells, risks to adjacent structures, pressure relief.
U.S. EPA
Stormwater Discharges from Construction Activities (NPDES — Construction General Permit)Dewatering discharge, turbidity monitoring, discharge controls, inspection, monitoring, reporting (United States).
Government of Ontario
Construction dewatering — water-taking and discharge requirements (Ontario)Construction-site dewatering, water-taking requirements, discharge requirements, monitoring, reporting (Ontario, Canada).
Government of British Columbia
Water licences, approvals, and groundwater diversion requirements (British Columbia)Construction dewatering, groundwater diversion, authorization requirements, exemptions, environmental considerations (B.C., Canada).
Dewatering Insights
An educational reference on construction dewatering, groundwater, drawdown, and monitoring — built for engineers, geoscientists, and field crews.
This page is educational and does not constitute engineering advice. Dewatering design and assessment require project-specific professional engineering and hydrogeological judgment. Illustrative values shown are conceptual, not site-specific predictions.